SAFEGROWTH® BLOG
regular contributors
GREGORY SAVILLE · MATEJA MIHINJAC · ANNA BRASSARD
GREGORY SAVILLE · MATEJA MIHINJAC · ANNA BRASSARD
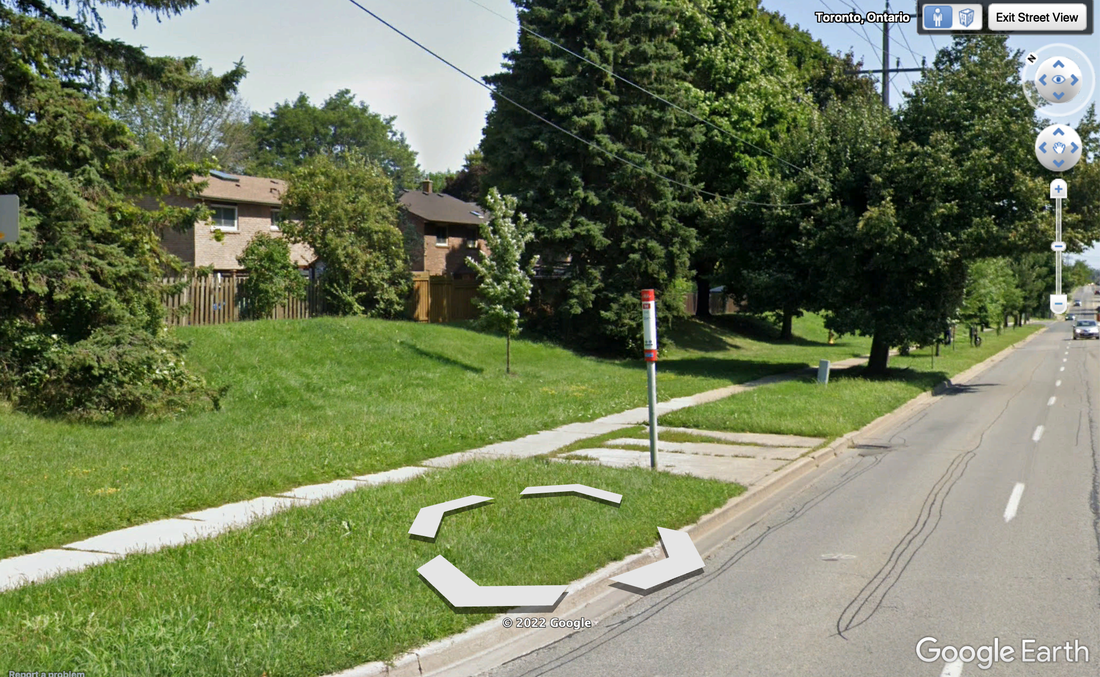
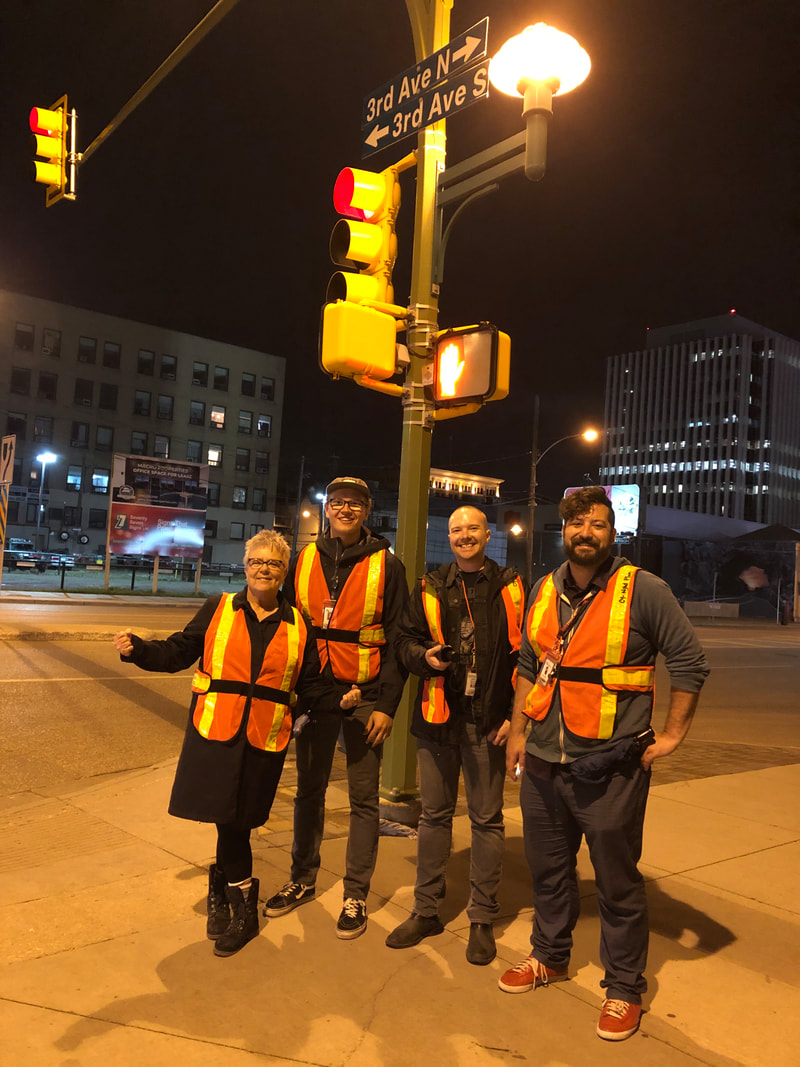
Bus stop location in Scarborough not far from where Paul Bernardo waited at night to follow and sexually assault women
by Gregory Saville Between May 1987 and June 1990, Toronto police investigated the case of the Scarborough Rapist - Paul Bernardo. Scarborough is a sprawling suburb of Toronto and at the time the fear of a serial rapist spread across the entire Toronto metro like wildfire, especially along public transit lines. This notorious and horrific case is well-known in Canada and eventually led to the arrest and conviction of Paul Bernardo, the rapist (by that time, tragically, a serial murderer). I first learned of this case as a police patrol officer 25 miles west of Scarborough, but we knew very little about the facts at that point. Coincidentally, I was also in urban planning grad school at that time and one of my professors asked me to join a new group conducting field visits and safety reviews on the Toronto transit bus and subway system resulting from the Scarborough rapes. They created their audit form from research on CPTED and they were calling it a safety audit. That is how the safety audit was born – out of tragedy and necessity. Up to that point, fear of crime patterns was surmised from generic surveys, but specific geographical details were sketchy. We knew from interviews what residents said about fear, but little about the specific places that triggered those fears. The Safety Audit changed all that. 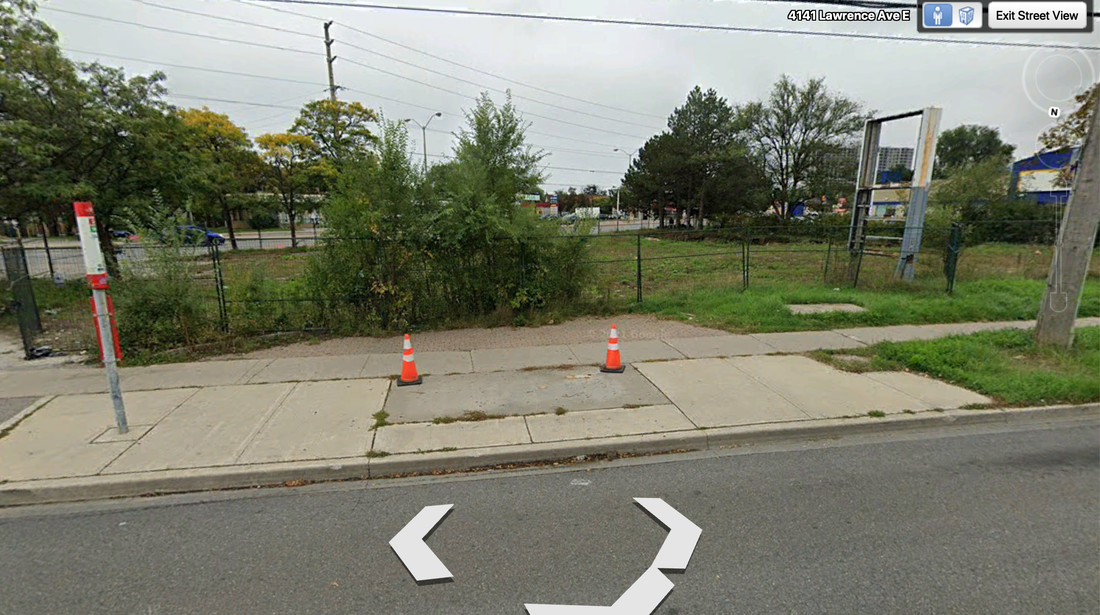
Today, many Scarborough bus stops are not much better than in the late 1980s
SAFETY AUDITS IN COLORADO A few days ago I helped a local transit committee conduct their first Safety Audit on a bus stop near my home – the first audit of its kind in Colorado. What we found was fascinating. We discovered an isolated and remote bus stop location with few nearby opportunities for natural surveillance. We learned that bus drivers reported disorderly incidents on this route and that this stop was the end of the line and was nowhere near restroom facilities. We also uncovered a nearby shopping mall with numerous crime incidents, including a recently burglarized restaurant when we discovered a jimmied front door (we called the police). Thus, we were able to report a crime before the owner learned about it. I spoke to him when he arrived and, naturally, the poor fellow wasn’t happy! He was the latest victim of crime in this shopping mall next to our bus stop. As this transport committee learns how to use the Safety Audit process, they will eventually have the capacity to conduct other safety reviews across other parts of the transportation system. 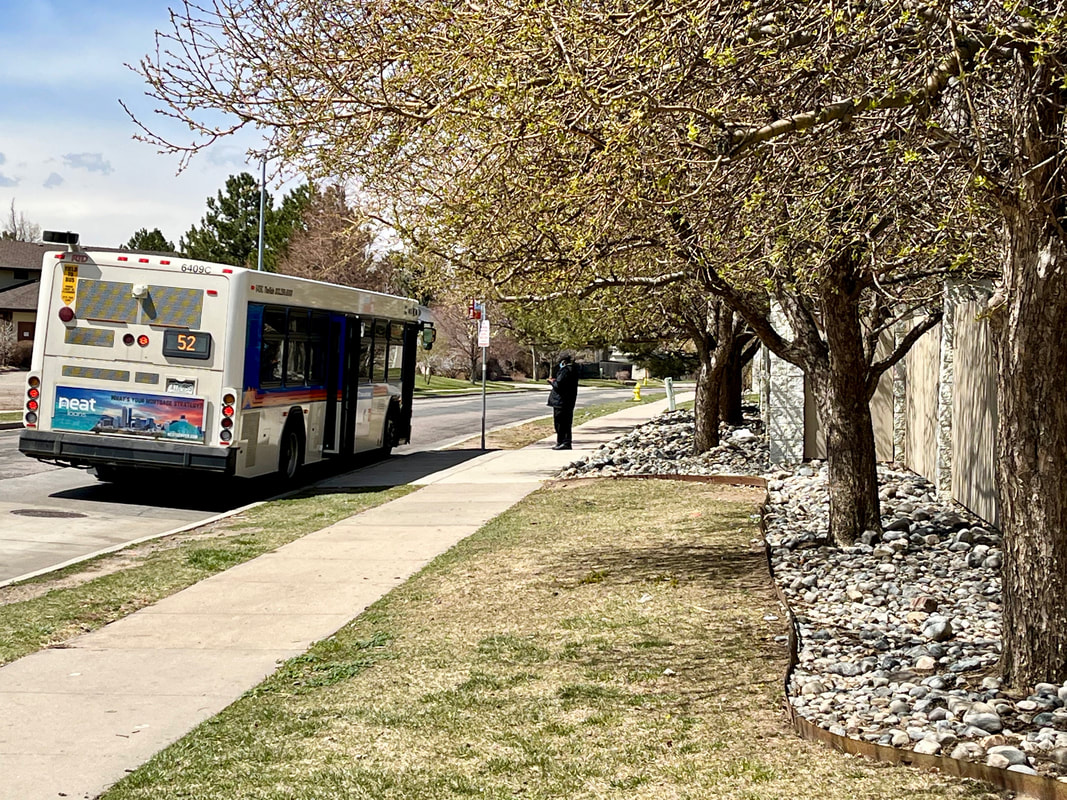
Metro Denver bus stop location a few days ago during our Safety Audit - many similarities to other cities
SIMILAR AROUND THE WORLD Safety audits are not new to this blog. Seven years ago, Tarah blogged on how to teach high school students the art of the Safety Audit in Every time they want to count you out – use your voice. Four years ago I blogged on safety audits in A Tool for the Archeology of Fear. I described the mistake CPTED practitioners make when they confuse safety audits with CPTED surveys or visual checklist inspections. Some conflate Safety Audits with Jane’s Walks or Night-Out-Against-Crime. They too are wrong. Then, two years ago, Mateja blogged on how she digitized our Safety Audit process for measuring fear in downtown Saskatoon. What struck me this week is not how much the committee members enjoyed the Safety Audit process. That is a comment SafeGrowth advocates hear commonly during our training. Rather, the most striking thing was how similar design and location problems arise over and over at bus stops here and elsewhere. We have taught audits from Melbourne Australia, Christchurch New Zealand, San Diego California, and Calgary Alberta, to New York City, and Helsingborg Sweden. We usually uncover similar fear and crime opportunity risks in those cities just as they existed in Scarborough during the Paul Bernardo rapes 30 years ago. Will we never learn?
0 Comments
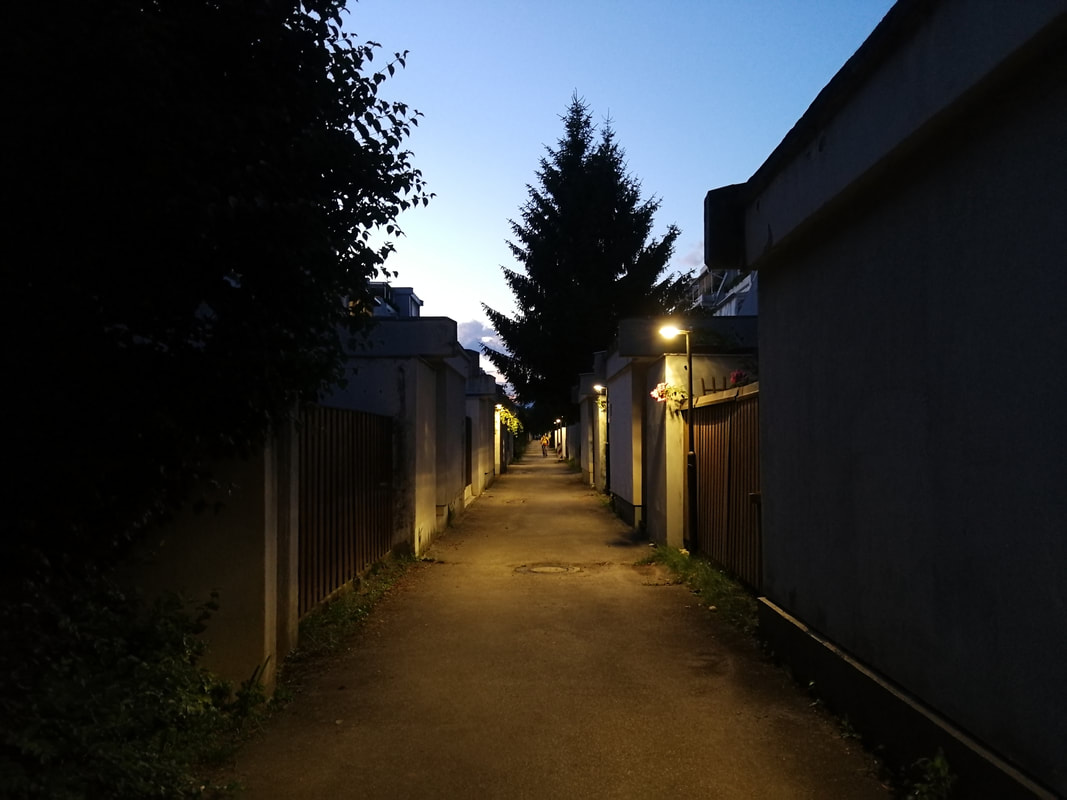
by Mateja Mihinjac Winter influences how we use our neighbourhood. Because of short daylight hours and cold weather, walking the neighbourhood is often an isolating experience. Current COVID lockdowns all across the world make these changes even more pronounced. All this affects the perception of safety of local residents, especially regarding residential laneways that may become risky movement predictors. RESIDENTIAL LANEWAYS Residential laneways, also called alleys, back lanes or catwalks, are a welcome addition to the neighbourhood when they provide accessibility, shorten travel paths, and enhance walkability. They can serve as positive places for interaction. Some blame these micro-places for increasing opportunities for crime. Research suggests that laneways can facilitate crime opportunities by contributing to increased levels of noise, property crime, antisocial behaviour and fear. 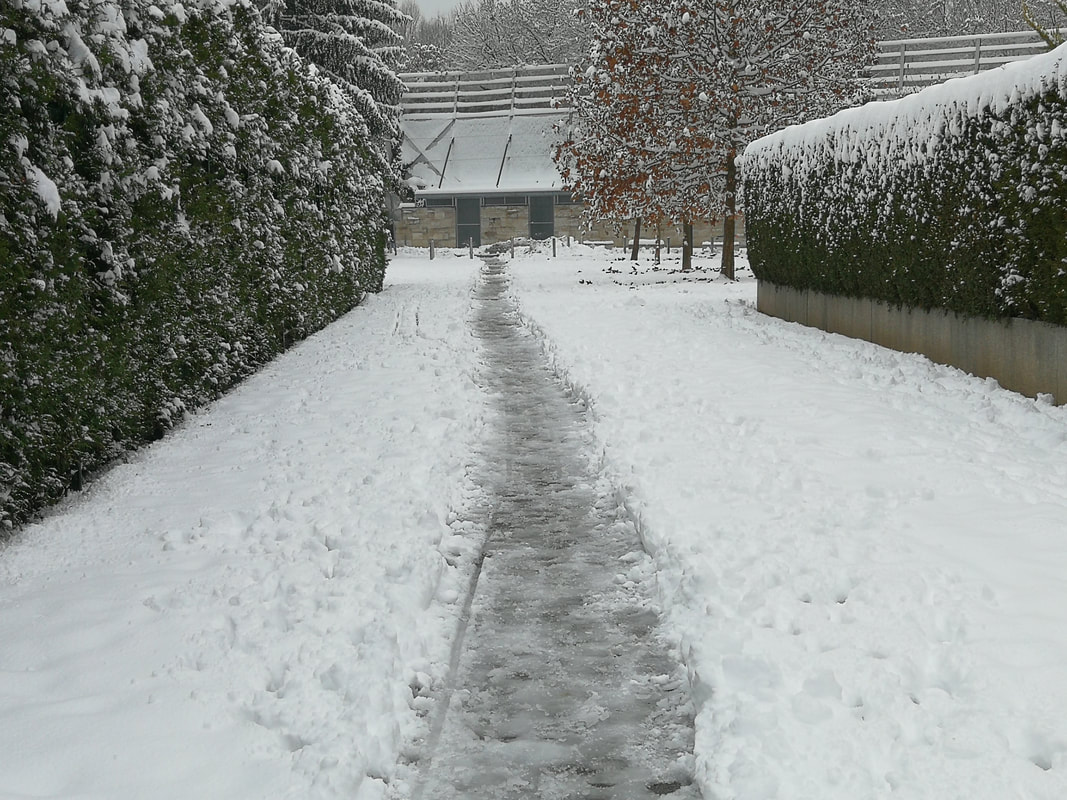
Yet others argue that laneway research shows improvements in social and environmental sustainability, which lead to better safety and perception of safety outcomes. Positive laneway design has a buffering effect on crime and vulnerable targets due to increased informal social controls stemming from higher levels of social cohesion. Therefore, the question is not whether laneways have a place in the neighbourhood because they might trigger crime opportunities – laneways have many positive attributes that contribute to walkability and neighbourhood liveability. Rather the question should be how do we better design laneways and make them safe. POOR DESIGN Many laneways are separated from neighbouring courtyards with high non-permeable fences that offer few opportunities for natural surveillance and interaction. Such laneways create tunnel-like gauntlets that are unattractive, especially at night. 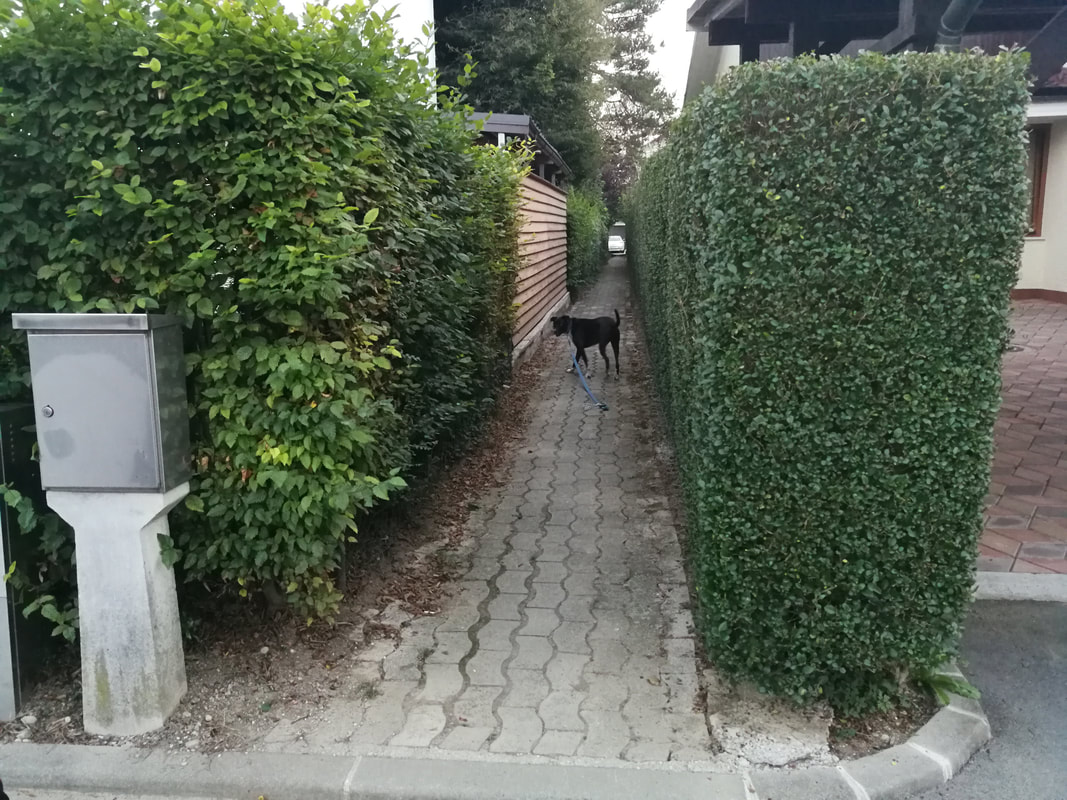
In addition to this, many laneways, especially in North America, are positioned along backyard residential garage areas intended predominantly for vehicles and rubbish removal. No wonder these laneways become a “no man’s land” and thus lead to safety concerns described earlier. One of our project teams from a recent Calgary SafeGrowth training identified that residents were concerned with hiding spots, poor visibility in the dark, graffiti on tall fencing, and similar. Clearly, laneway designers must create open and attractive areas that pay attention to pedestrian use. 
IT’S MORE THAN CRIME The second issue is that the laneway debate centres exclusively around crime prevention. Little attention is given to larger issues such as the type of the laneway and neighbourhood structure. Conversely, much of urban design literature speaks to the importance of integrating multiple liveability indicators and considering safety as an integral rather than isolated indicator of laneway suitability. As architecture professor Kim Dovey says, “I begin from the view that the urban public realm needs to be at once safe, accessible, vital, creative and democratic.” Criminologist Paul Cozens believes that when the discussion centres around crime prevention alone, we make laneways hostile to human-scale design. In fact, he claims we can inadvertently “design in crime” while the residents become isolated from one another and from the outside neighbourhood. When our Calgary team spoke to residents they found that the residents often referred to other quality of life concerns that affected their use of the laneways rather than safety concerns alone. Some of these included poor maintenance, tripping hazards, poor wayfinding, and integration of laneways with the street. Again, this suggests we must consider laneways more holistically, not strictly with a crime prevention eye, and we must reconcile safety with other liveability indicators. 
WHAT CAN BE DONE? Despite the potential safety risks, there are many benefits of well-designed and well-functioning residential laneways. If designed well, they can further enhance community capacity-building and create a sense of neighbourhood. There are some excellent toolkits describing how to accomplish these goals. They include a Turning Laneways into Public Places document and a Reimagine Catwalks Playbook. As we say repeatedly in SafeGrowth, what matters most is collaborative design with residents – not designing to or for them. This is how we use laneways, not as dreadful shortcuts and fear-inducing places, but as shortcuts for building the neighbourhood. 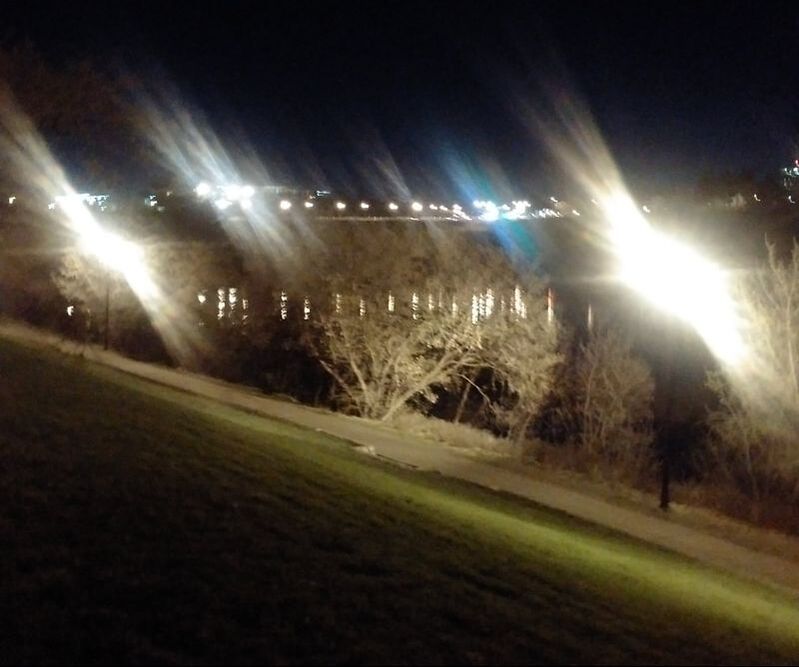 Saskatoon river trail at night by Mateja Mihinjac This summer, I led a team of eight city planners and set out to explore how the physical and social environment in downtown Saskatoon, Canada influences perceptions of personal safety. This was the first-ever micro-level, fear and safety project to use a specially tailored, digitized software app to map and analyse downtown safety in Canada. This is something geographers of crime and environmental psychologists have been studying for decades, but often without the precise measurements that we were about to uncover. MEASURING PERCEPTIONS OF SAFETY Perceptions of safety have been understudied in the field of criminology despite knowing that they may affect people’s use of the public realm more than actual crime. Moreover, from Crime Prevention Through Environmental Design - CPTED - we know that features on the streets, parks, and neighborhoods where we live may promote or reduce fear in that environment. Yet, we rarely measure this association. 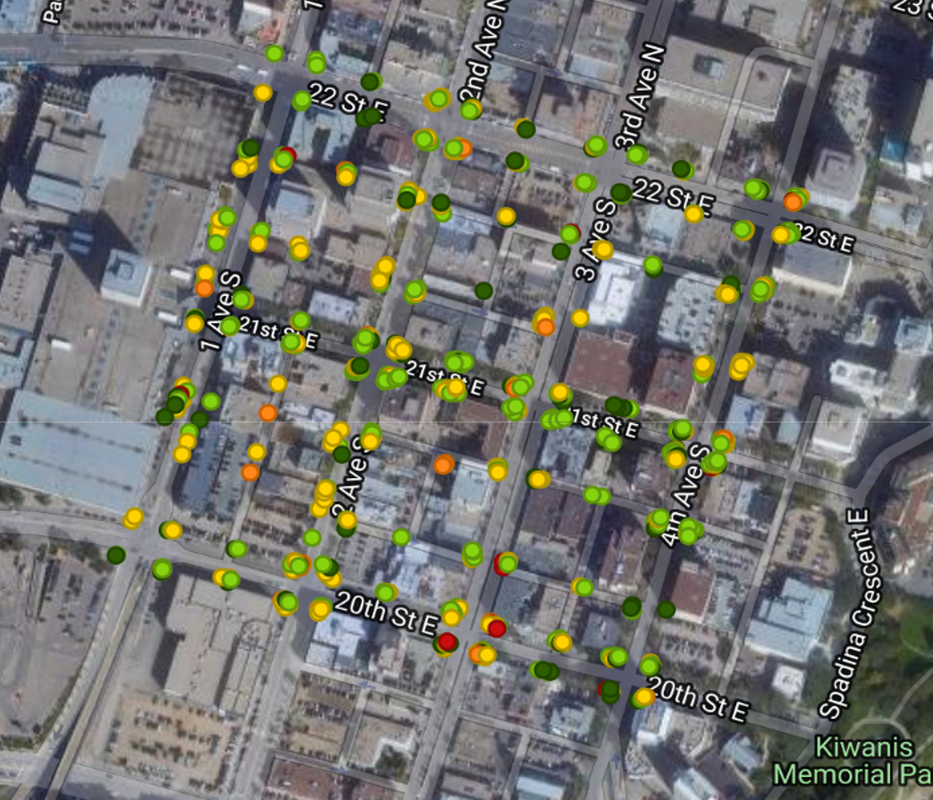 Downtown Saskatoon street research locations As a criminologist specializing in SafeGrowth and CPTED, the City of Saskatoon planning department hired me for the summer of 2019 to develop and pilot this downtown project. The first step included the development of the field data collection survey, a modified version of the Neighbourhood Safety Audit that incorporates the principles of CPTED. The survey was then digitized in a GPS location-based data collection app called Fulcrum, that allowed us to capture and record data with our mobile devices for use in subsequent analysis. DATA COLLECTION We formed two research teams of four participants from the Saskatoon Planning & Development Division. Each participant had undergone CPTED/SafeGrowth training and was knowledgeable about urban design and safety. Teams collected night and daytime data within the downtown area over 13 days. 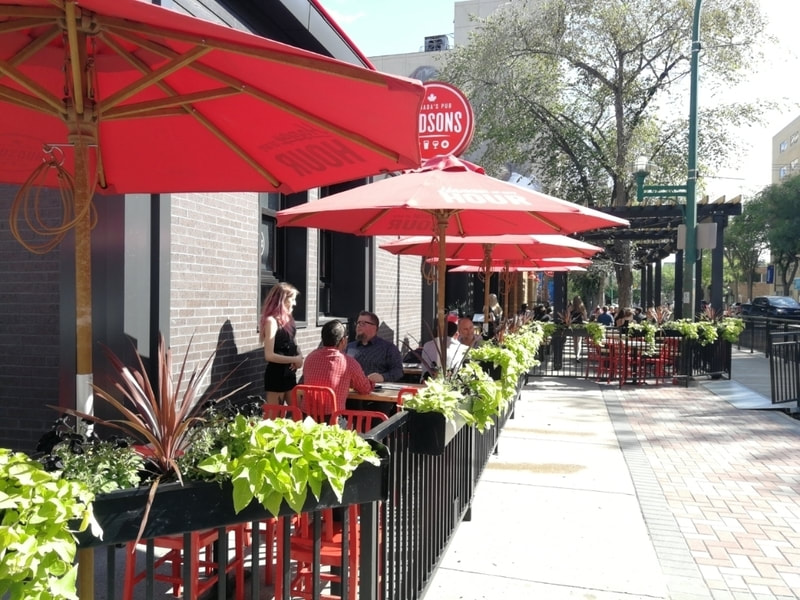 Daytime audits were combined with evening audits of the same locations Because we were interested in perceptions and fear at a very micro-level, the study area was confined to the blocks and laneways within a four block area. We used our new app to collect information from 108 micro-spatial locations within a radius of 30 meters (100 feet) of each location, and then we also collected 596 additional intercept surveys with members of the public on the street at the time. Detailed fieldwork like this is laborious and time consuming, but teams were diligent and we were able to gain invaluable insights, in some cases uncovering findings about fear that were previously unknown. 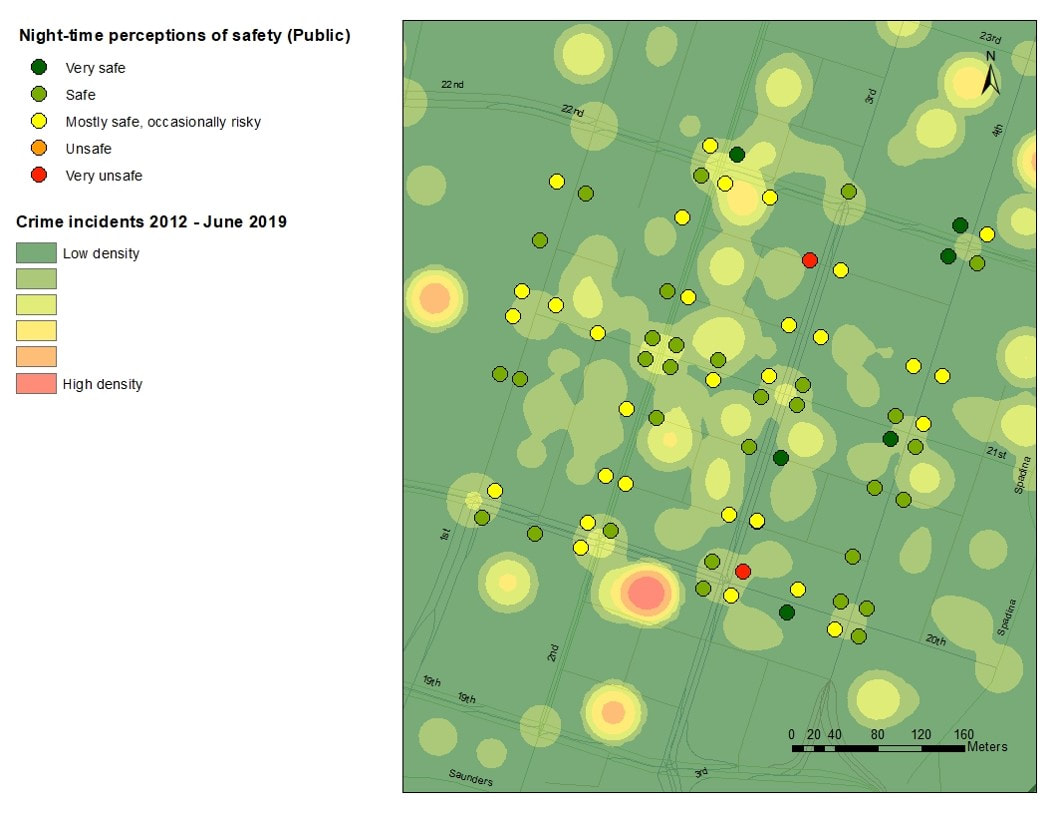 Fear and safety perception maps can be correlated with actual crime maps PRELIMINARY FINDINGS What did we learn?
 One of the city planner audit teams during night field work FINAL THOUGHTS In our SafeGrowth training we often say: Once you learn CPTED you’ll never again look at the environment the same way. However, CPTED novices often forget that the environment encompasses both physical and social. This research provides evidence about the interplay between the physical and social environments on public perceptions. Clearly, physical and social CPTED strategies are equally important and must be part of all planning and prevention.  Fear and risk are two very different things. Solving one does not always solve the other. I live in one of the most livable towns in the country. It has a variety of bookstores, an active and safe teen skate park, accommodation for the elderly, alternative housing options like cohousing, and two local industries. There are over 40 restaurants for just 8,000 people (obviously a tourist town) and a festival every weekend from spring till winter. It has one of the most successful farmers markets and a vibrant and architecturally interesting downtown. There hasn't been a murder in the city for decades and last year there were 52 violent crimes (mostly minor assaults) in the county with about 29,000 residents producing a county violence rate of 17 violent incidents per 100,000 residents. In short, it is safe and vibrant. Gotham City crime New York City is also one of the most vibrant cities in the country and by every meaningful measure, it dwarfs my town. It has thousands of restaurants, bookstores, festivals, and every other amenity imaginable serving a city of over 8 million. It has a lower crime rate than most large cities. Yet, in comparison to my town the violent crime rate last year in NYC was 55 violent crimes per 100,000 residents. In other words, the violent crime rate there was three times higher than here. Yet a former neighbor, a young woman who lived in New York until recently, describes feeling much safer on New York streets than here. She is more concerned about walking home in the dark here than walking there even though her actual risk is 3 times higher (To be fair I doubt she knew the different rates, only how she felt). Why? The Truth about Risk Perception and risk are two entirely different animals. I have spent many years working in high crime places. I learn about the cues of environment, attitude of the locals, and actual crime risks. My first lesson - we may feel safe but not be so. This week I read a great blog about crime risk by Sam Harris titled The Truth about Violence. He cites four basic safety principles including how to avoid dangerous places and people. Harris also describes a truism about us: It is unpleasant to study the details of crime and violence—and for this reason many of us never do. I am convinced, however, that some planning and preparation can greatly reduce a person’s risk. I agree. Read Harris's blog. It's worthwhile.  "UnHappy Trails? Where's the research?" No doubt considerable fear exists on the streets of London after this week's riots. Whole books are written on urban crime and fear. What about rural places far from urban mayhem? The Gabriola Island murders from last blog suggest rural crimes too ferment fears of public places like nature trails. This is ironic. Parks and trails are statistically far safer than bars at closing time or inside homes when domestic strife turns violent. Study after study tell us public trails are safe, such as Tod Schneider's article on bike trails back in 2000. Yet those are urban studies. Research has yet to examine rural nature trails and crime. CPTED was born, after all, in the city. I was recently interviewed by a horticulture magazine about trees and crime asking these very questions. The article, Trees Thwart Shady Behavior, described a study on crime and residential trees by examining 2,813 single-family homes in Portland, Oregon. Controlling for visual appearance, presence of barriers, and street activity, the study showed "houses fronted with more street trees had lower crime rates". That was all crime rates, including vandalism and burglary. Read it HERE. |
CONTACT[email protected]
|

SafeGrowth® 2007-2024
|
SafeGrowth® is a philosophy and theory of neighborhood safety planning for 21st Century.
|